
Interactive learning / Air & human performance
Biological Side Effects of Air Quality
Explore CO₂, TVOC, PM2.5, NOx, temperature and humidity independently. Illustrative exposure indices—not disease probabilities.
Demonstration: real readings from Clinarivo's own Awair sensors, read-only.
Live sensor
Updated 3:42:26 PM · refreshes every minute
Temperature
23.4 °C
Awair Oairo_iAQ_UAE Audit · 10/28/2026, 3:42:26 PM
Humidity
68.9 % RH
Awair Oairo_iAQ_UAE Audit · 10/28/2026, 3:42:26 PM
CO₂
461 ppm
Awair Oairo_iAQ_UAE Audit · 10/28/2026, 3:42:26 PM
TVOC
147 ppb
Awair Oairo_iAQ_UAE Audit · 10/28/2026, 3:42:26 PM
PM2.5
18 µg/m³
Awair Oairo_iAQ_UAE Audit · 10/28/2026, 3:42:26 PM
Effects below use live values for 5 reading(s); unmeasured inputs (e.g. NOx) are held at clean-air baseline, not estimated.
Cognitive function
Baseline effect
Illustrative exposure index: 0 = clean air, 100 = the model's worst case. Not a % loss of function, a risk or a personal measurement.
Responds only to: CO₂ + TVOC
Cited finding: Controlled chamber studies found lower decision-making scores at higher CO₂ and VOC levels.
Evidence, limits & sources
Limits: Small samples of healthy adults, short exposures; not a measure of any individual's brain. Colour weighting is a design assumption.
Cardiovascular
Heart & circulation · Mild
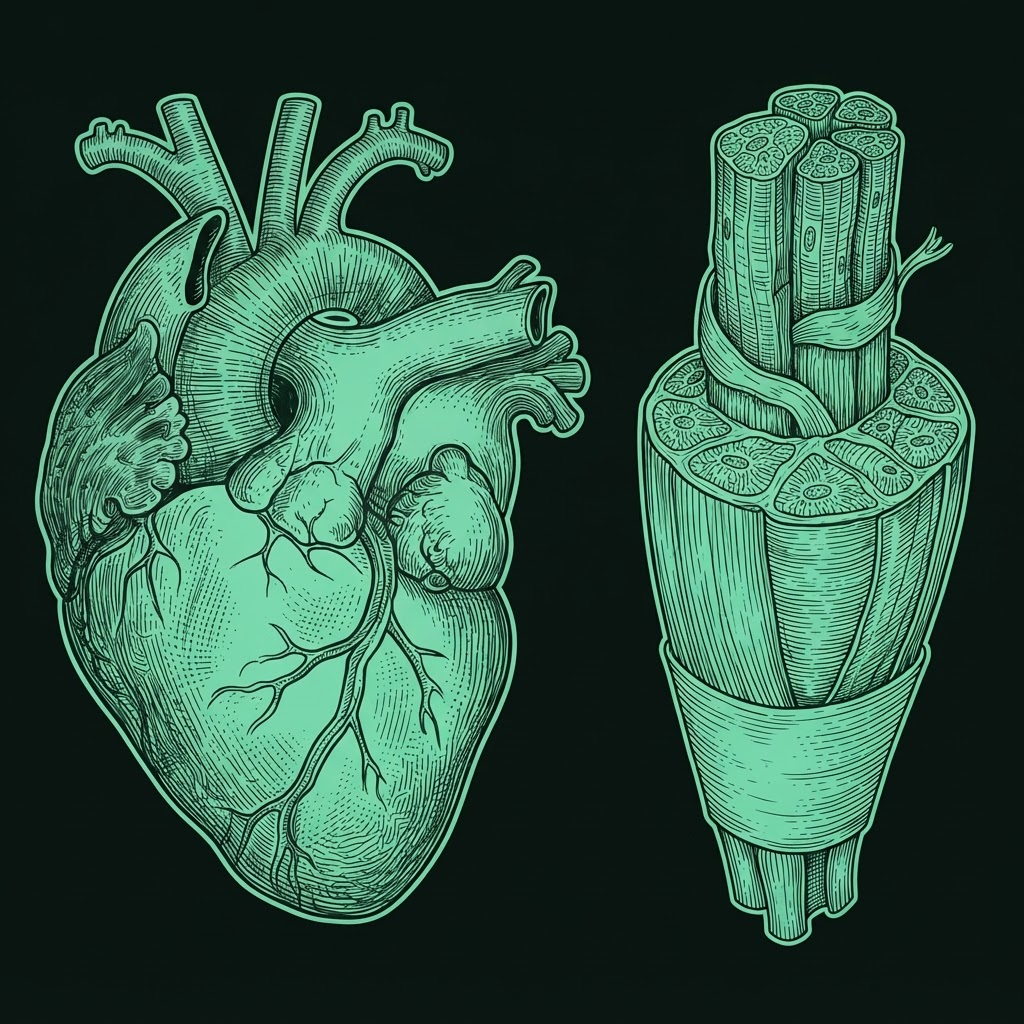

Illustrative exposure index: 0 = clean air, 100 = the model's worst case. Not a % loss of function, a risk or a personal measurement.
Responds only to: PM2.5 + NOx
Cited finding: Fine particles and combustion gases are associated with cardiovascular strain and events.
Evidence, limits & sources
Limits: Population associations; exercise-performance effects are less well quantified. Colour weighting is a design assumption.
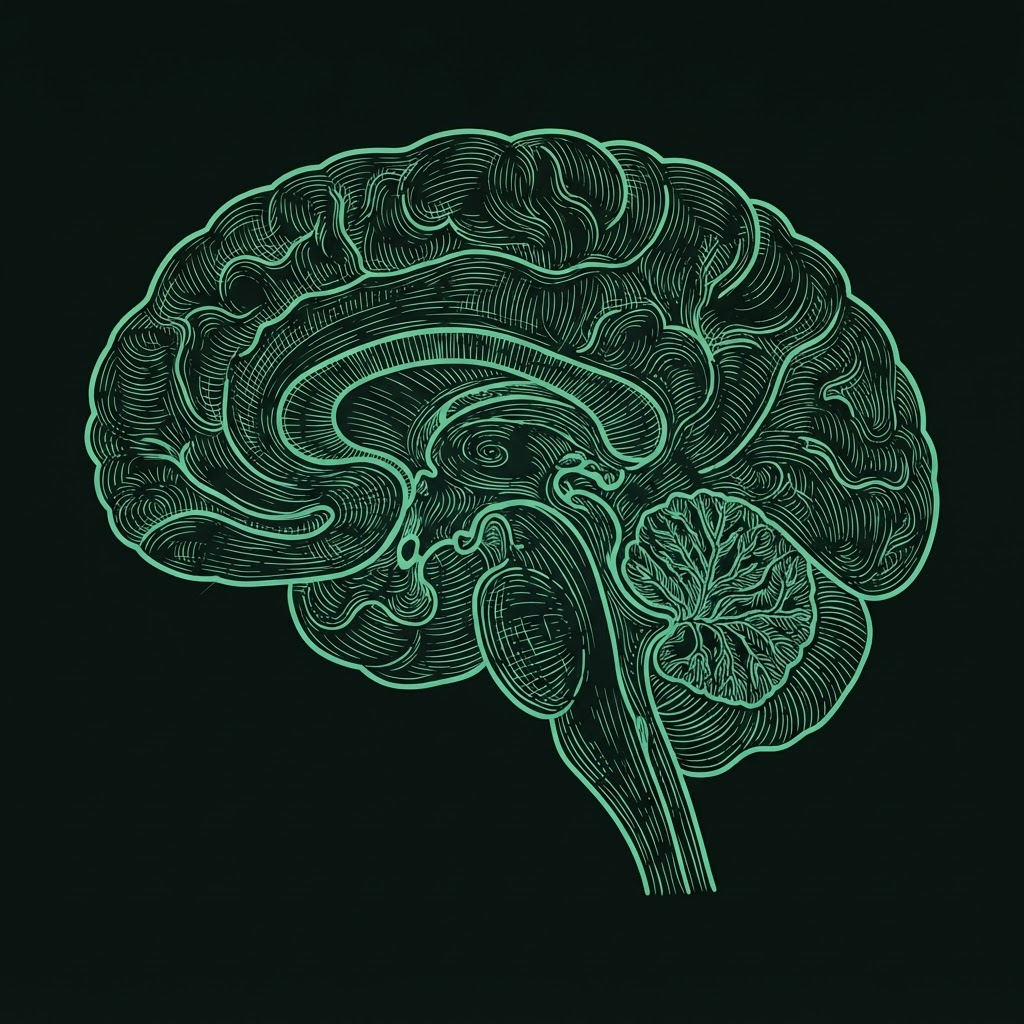

Cognitive exposure index 11/100 · CO₂ + TVOC only · Berkeley Lab reference
11/100 is an illustrative exposure index (0 = clean air, 100 = model worst case). It is not a 11% loss of cognitive function; the study figures below are the measured effects.
Satish et al. (2012): 600 ppm was the reference level. At 1,000 ppm, scores were 12–23% lower on 6 of 9 decision-making scales. At 2,500 ppm, large reductions appeared on 7 of 9 scales.
Read the studyReproductive health
Fertility · Mild exposure
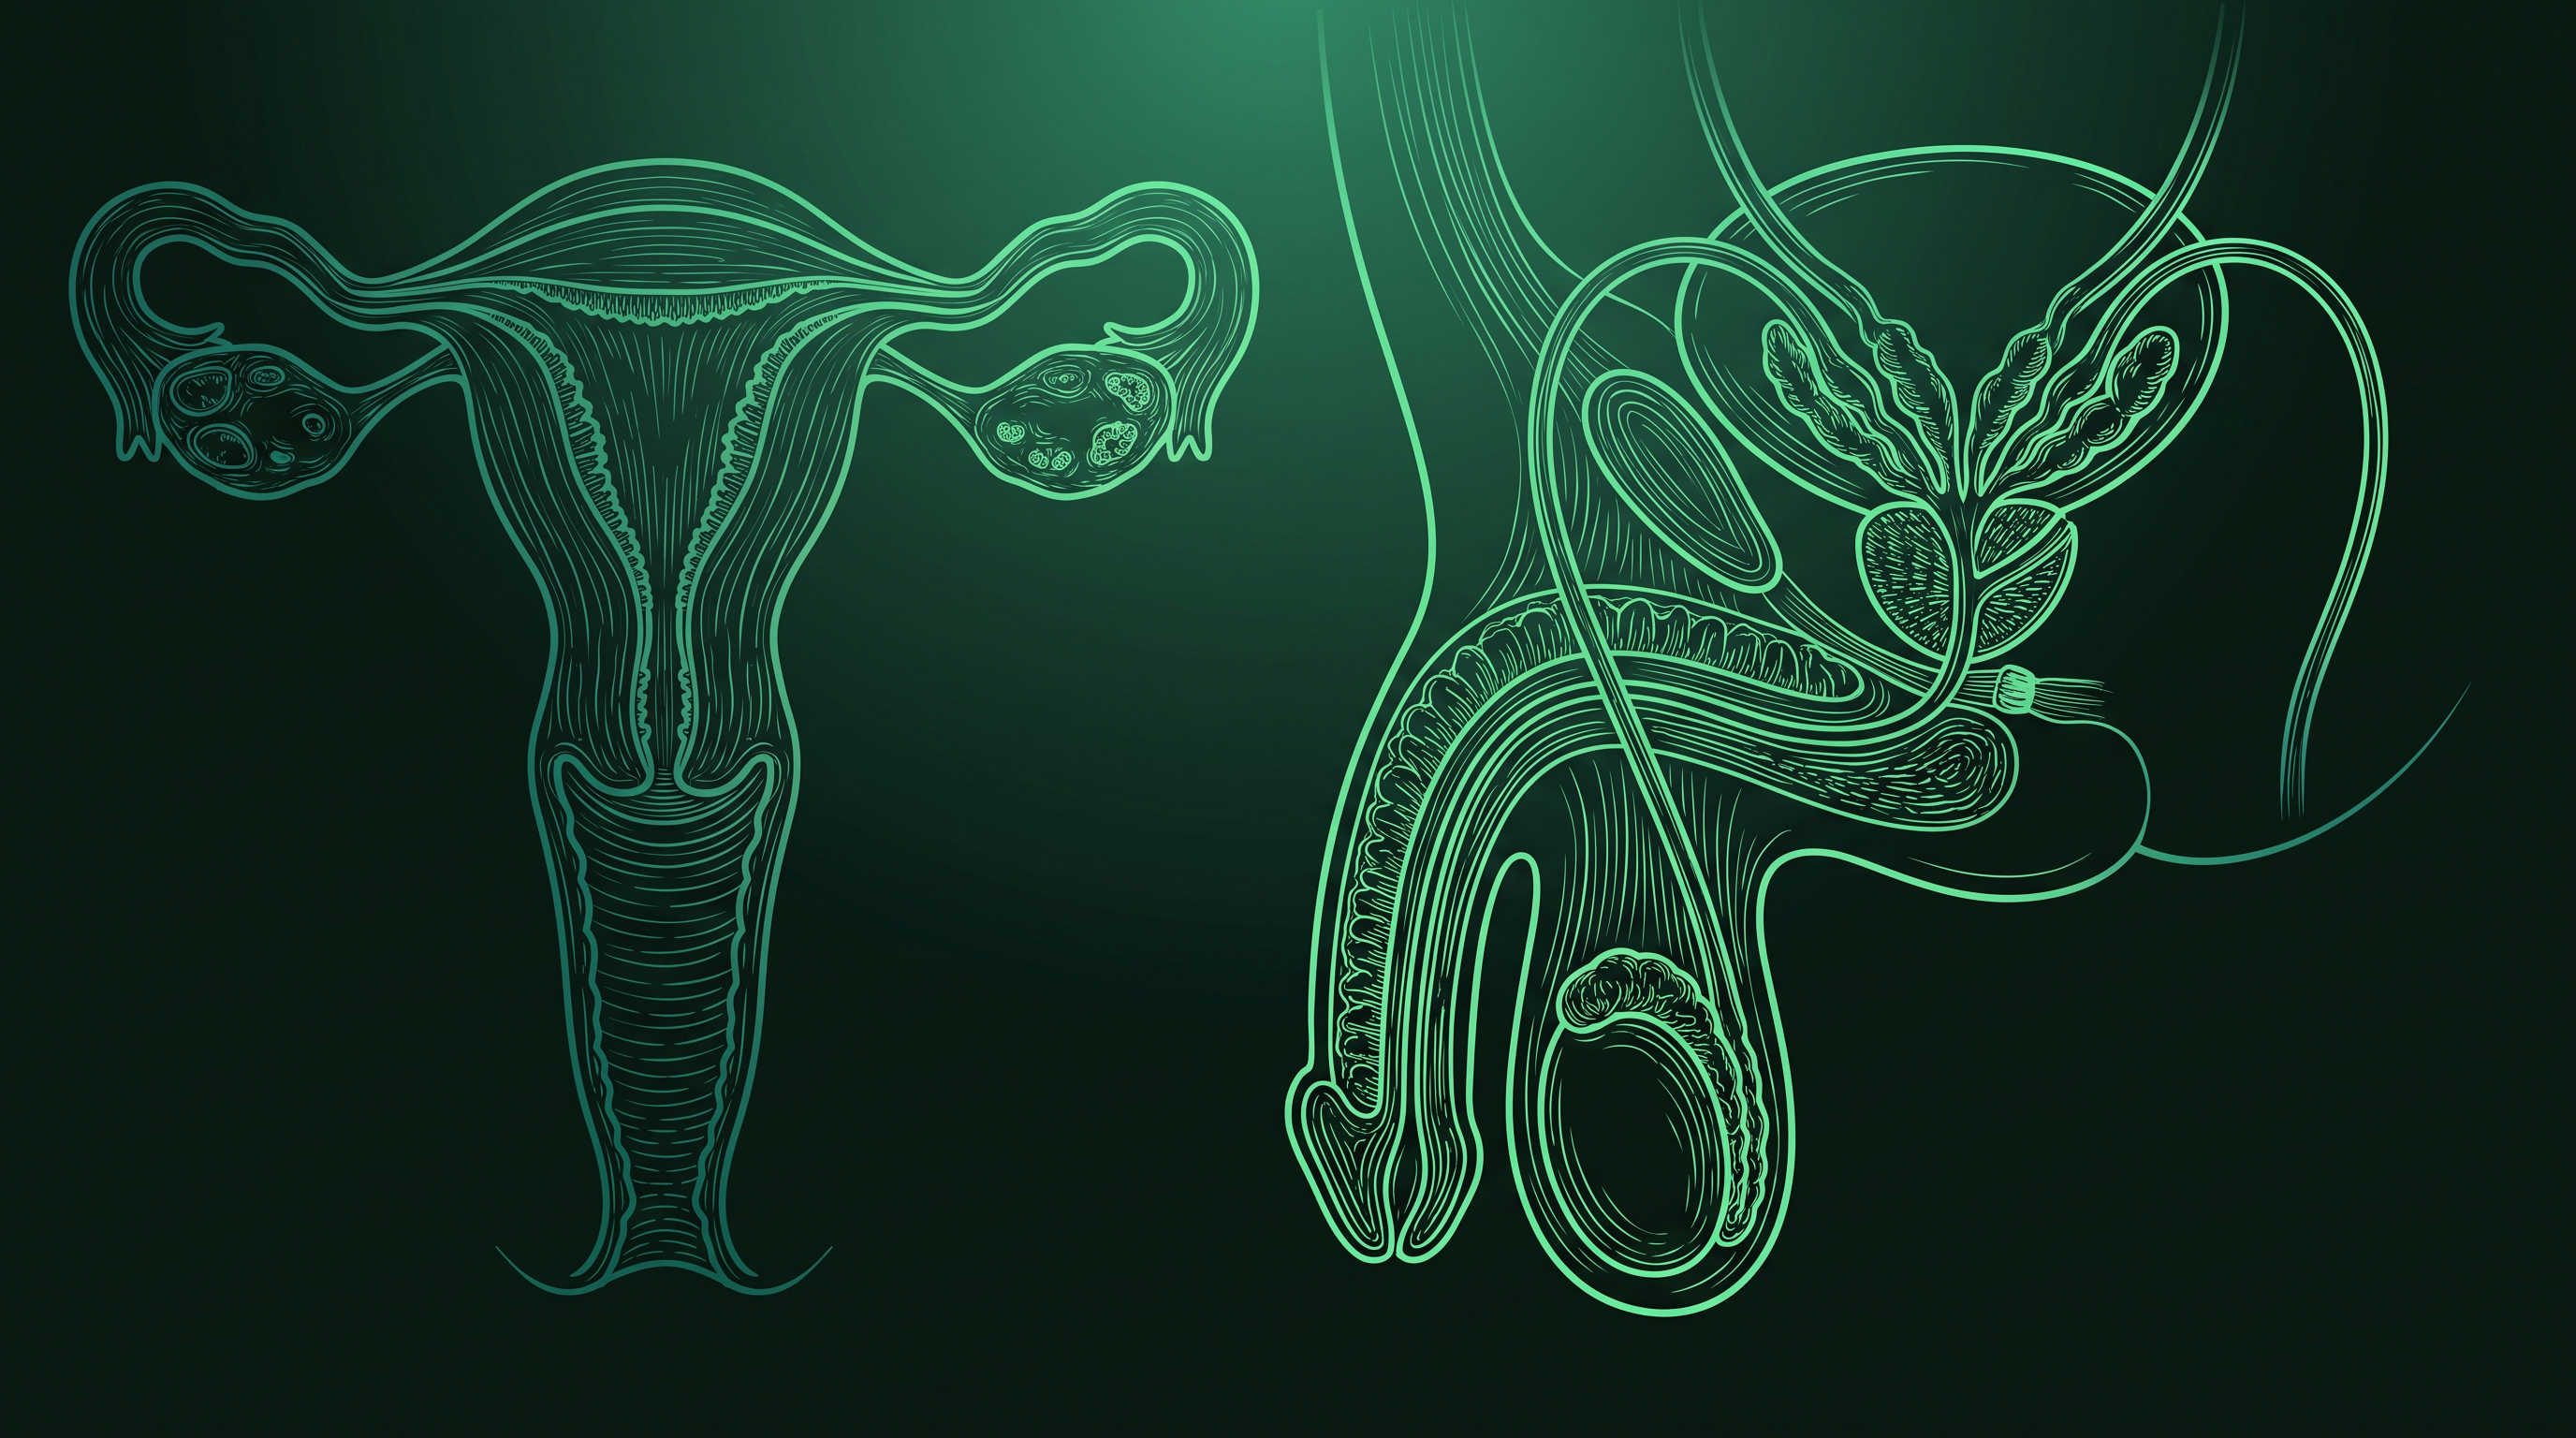
The tint shows exposure to pollutants that studies associate with fertility outcomes. It is not a fertility score or prediction.
Responds only to: PM2.5 + NOx
Cited finding: Reviews report associations between PM2.5 / NO₂ exposure and lower semen quality and female fertility outcomes.
Evidence, limits & sources
Limits: Observational associations; colour shows exposure to linked pollutants, not fertility. Colour weighting is a design assumption.
Read me
About this illustration
Each illustration is tinted green → amber → red using only the pollutants its cited research links to that body system. Strengths and weights are design assumptions for learning, not measurements or diagnoses.
WHO 2021
WHO reference values
- PM2.5 annual guideline5 µg/m³
- PM2.5 24-hour guideline15 µg/m³
- NO₂ 24-hour guideline25 µg/m³
- NO₂ annual guideline10 µg/m³
Respiratory
Lungs · Mild
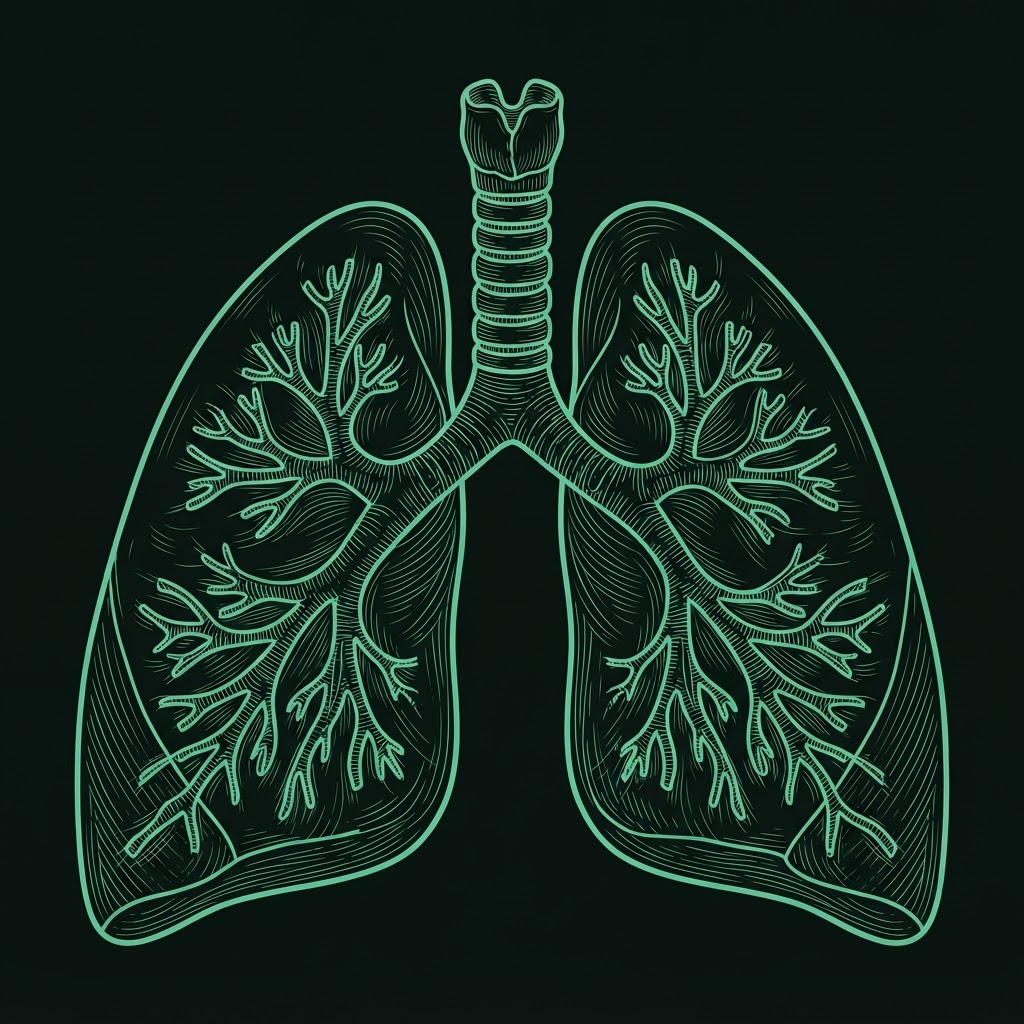

Illustrative exposure index: 0 = clean air, 100 = the model's worst case. Not a % loss of function, a risk or a personal measurement.
Responds only to: PM2.5 + NOx
Cited finding: PM2.5 and NO₂ are linked with reduced lung function, airway inflammation and asthma symptoms.
Evidence, limits & sources
Limits: Guideline values reflect population risk, not effects for an individual exposure. Colour weighting is a design assumption.